

A credible savings estimate starts with 12 months of electricity bills and interval load data, then matches those figures against time-based solar production rather than applying one annual percentage. By the end, you will be able to separate self-consumed power, exports, demand-charge reductions, battery value, project costs, and uncertainty into a decision-ready comparison.
Key takeaways
- Collect 12 consecutive electricity bills and matching interval data.
- Measure savings from self-consumption, exported power, and demand charges.
- Model solar production against the hours your business uses electricity.
- Stress-test payback, cash flow, and forecast risk before approval.
Build the Baseline From 12 Months of Electricity Bills
Do not estimate commercial solar savings from an annual kWh total. Collect 12 consecutive months of commercial electricity bills, then request 15-minute or hourly interval data for the same period. The bills show what you paid; interval data shows when the site used power, which determines self-consumption and demand-charge savings.
Record each billing period and extract these figures:
- Monthly kWh consumption, meter-opening and closing dates, and the number of billed days
- Energy rates by tariff slab and time-of-use period
- Monthly billed peak demand, demand-charge rate, and the unit used for demand
- Fixed charges, minimum-billing charges, taxes, fuel or other riders, and power factor penalties
- Sanctioned load, contracted demand, and any recorded excess-demand charges
- Net-metering credits, export rates, carry-forward credits, and credit expiry rules
| Record | Figures to capture | Why it matters |
|---|---|---|
| Monthly bill | kWh, billing dates, energy rate, fixed charge, taxes | Reconstructs the actual baseline bill |
| Tariff schedule | Peak and off-peak prices, demand rules, ratchet, minimum demand | Determines the value of each avoided kWh and kW |
| Interval data | Load for every 15-minute or hourly interval | Matches consumption with simulated PV output |
| Connection records | Sanctioned load, contracted demand, export limit | Prevents an oversized or non-compliant design |
Treat demand separately from energy. Solar does not reduce the demand charge unless it lowers the utility-defined monthly peak; an early-morning or cloudy-period spike can leave that charge unchanged. Also confirm whether exports receive retail credits or a lower avoided-cost rate before projecting savings.
Match Solar Production to the Hours Your Business Uses Power
Annual electricity use cannot show how much solar power will reduce your bill. Match 15-minute or hourly interval load data with a time-series solar yield estimate for the proposed array, using site conditions, equipment limits, weather, shading, and orientation.
For each interval, calculate the energy flows separately:
- Self-consumption = the smaller of solar production and the business load.
- Grid export = solar production above the load, subject to the utility’s export limit.
- Grid import = load remaining after solar production.
Sum those results across the year. A factory using power during sunny hours will self-consume more generation than an office closed on weekends, even when both have the same annual electricity use. Do not treat total annual PV output as bill savings; exported energy may receive a lower credit than the retail energy rate.
Test the array at its proposed size, then compare a smaller design if grid export is capped or credited at an avoided-cost rate. Oversizing the system can increase gross generation while weakening cash flow through curtailment and low-value exports.
Keep demand charges separate from energy savings. Solar reduces a monthly billed peak only when production overlaps the utility’s defined demand interval and lowers that month’s highest recorded demand. An early-morning, evening, or cloudy-period spike can leave the demand charge unchanged.
Apply the stated degradation assumption to later years rather than carrying first-year production unchanged through the forecast. Include export controls, curtailment, and interconnection limits as explicit reductions in usable generation.
Calculate Bill Savings With a Worked Commercial Example
Use 15-minute or hourly load data to value each kilowatt-hour, not annual consumption alone. Your annual solar savings calculation should match simulated PV output against the energy tariff, including time-of-use charges, then separate self-consumed power, imports, exports, demand charges, fixed charges, taxes, and credits.
Illustrative annual figures:
| Item | Before solar | After solar |
|---|---|---|
| Solar generation | 0 kWh | 120,000 kWh |
| On-site solar use | 0 kWh | 90,000 kWh |
| Grid imports | 300,000 kWh | 210,000 kWh |
| Export credit | ₹0 | -₹90,000 |
| Energy charge | ₹3,000,000 | ₹2,100,000 |
| Demand charge | ₹600,000 | ₹504,000 |
| Fixed charges | ₹60,000 | ₹60,000 |
| Tax at 5% | ₹183,000 | ₹128,700 |
| Annual bill | ₹3,843,000 | ₹2,702,700 |
This example uses a ₹10/kWh energy rate, a ₹3/kWh export credit, and a demand charge falling from ₹50,000 to ₹42,000 per month. Demand-charge savings are ₹96,000, not 120,000 kWh multiplied by a demand rate; a cloudy-day or evening load spike can leave the billed peak unchanged.
Net annual bill savings equal ₹1,140,300: the old bill minus the new bill. Fixed charges remain because the connection still exists, while taxes and net-metering credits follow the utility’s billing rules. Exclude financing, maintenance, insurance, and replacement costs from bill savings, then subtract them separately to calculate project cash savings.
Compare On-Grid Solar, Batteries, and Other Ways to Cut Costs
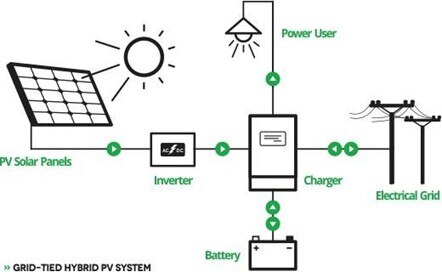
Battery storage improves financial returns only when its added revenue exceeds its installed cost and losses. Compare the on-grid versus hybrid solar case using interval data: include the battery’s round-trip efficiency, charging source, discharge schedule, cycle limit, export restriction, and demand-charge rules.
A battery saves demand charges only when it discharges during the utility’s billed peak.
| Option | Financial test | When it applies |
|---|---|---|
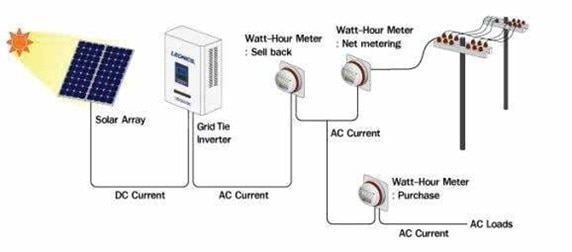
| On-grid PV | Value self-consumed kWh, exports, and demand reduction | Best when daytime load is strong and export credits are reliable |
| Hybrid PV and battery | Add peak-demand savings and shifted energy, then subtract efficiency losses and replacement reserves | Choose it when evening load or demand peaks justify the battery |
| Diesel generator | Compare fuel, oil, maintenance, start-up time, emissions compliance, and outage value with solar output | Use as backup; do not treat avoided diesel fuel as normal bill savings if the generator rarely runs |
| Power-purchase agreement | Compare the contracted solar rate, escalator, term, and buyout conditions with forecast utility rates | Useful when capital is limited and ownership returns are less important |
| Efficiency upgrade | Compare lighting, HVAC, motor, or control savings per rupee invested | Fund it first when it reduces daytime consumption or demand peaks |
| Phased PV system | Compare each stage’s cost, tariff savings, and interconnection work | Use it when capital, roof area, or sanctioned capacity limits the initial array |
Calculate utility-bill savings separately from total project savings. Subtract financing payments, insurance, maintenance, monitoring, taxes, replacement reserves, interconnection upgrades, and curtailment losses, then compare net present value and annual after-tax cash flow rather than simple payback alone. Test each option against independent production estimates and weather, shading, soiling, availability, and degradation cases.
Test Payback, Cash Flow, and Forecast Risk Before Approving the Project
Approve a proposal only after its annual after-tax cash flow remains positive under conservative production, tariff, and export assumptions. A commercial solar payback figure is useful for recovery time, but it is not a complete investment test.
| Measure | What it reveals | Warning sign |
|---|---|---|
| Net present value | Value after discounting future cash flows, financing, tax, replacements, and residual value | Negative NPV means the project destroys value at your required return |
| Internal rate of return | Annual return implied by the project’s cash flows | An attractive IRR can hide poor early cash flow or optimistic escalation |
| Levelized cost of energy | Lifetime cost per kilowatt-hour generated | It does not equal your bill saving when export credits and demand charges differ |
| After-tax cash flow | Whether each year covers debt, maintenance, insurance, and taxes | Positive energy savings can still leave a cash shortfall |
Require a 20- to 30-year model that states annual degradation. PVWatts commonly uses 0.5% per year; compare that output with the installer’s PVWatts comparison and ask whether degradation applies to the whole array or individual components.
Check the model against 15-minute or hourly load data, not annual kWh alone. Test self-consumption, export caps, low export credits, demand-charge peaks, interconnection upgrades, and an oversized array.
Ask Nature Tek Solar Pvt Ltd to show results under low, base, and high electricity-price paths, then subtract financing, operations and maintenance, monitoring, insurance, replacement reserves, incentives, and property-tax effects before accepting the quoted savings.
Related products
 | Understanding energy consumption is the first step toward cost-effectiveness. View product → |
 | Services Our Solar Rooftop Systems are tailored for residential, commercial, and industrial buildings. View product → |
Frequently asked questions
Why do commercial solar savings estimates need 12 months of electricity bills?
Twelve consecutive bills capture seasonal changes in consumption, tariff rates, fixed charges, demand charges, and billing periods. Use them to establish the site's actual annual cost before adding solar.
Why does the timing of electricity use matter for solar savings?
Solar produces power during daylight hours, so savings depend on how much generation your business consumes directly. Compare hourly or 15-minute interval usage with the solar production profile to estimate self-consumption and exported energy.
How do you calculate commercial solar bill savings?
Subtract the post-solar electricity cost from the baseline cost, including grid energy charges, demand charges, fixed charges, export credits, and operating costs. Test the calculation against a worked annual production and consumption example.
What should you compare before choosing on-grid solar or batteries?
Compare on-grid solar, battery storage, efficiency measures, load shifting, and tariff changes using upfront cost, annual savings, payback period, cash flow, demand-charge reductions, and forecast risk.
Related products
 | Making the switch to renewable power requires expert guidance. View product → |
 | Solar Plant End-to-End Development We provide customized plant development, managing everything from site assessment to final execution. View product → |
 | Products A Hybrid Solar System combines the best of both on-grid and off-grid setups by integrating solar energy, battery backup, and grid power into one... View product → |
 | Products An On-Grid Solar System, also known as a Grid-Tied System, is connected to the main power grid. View product → |